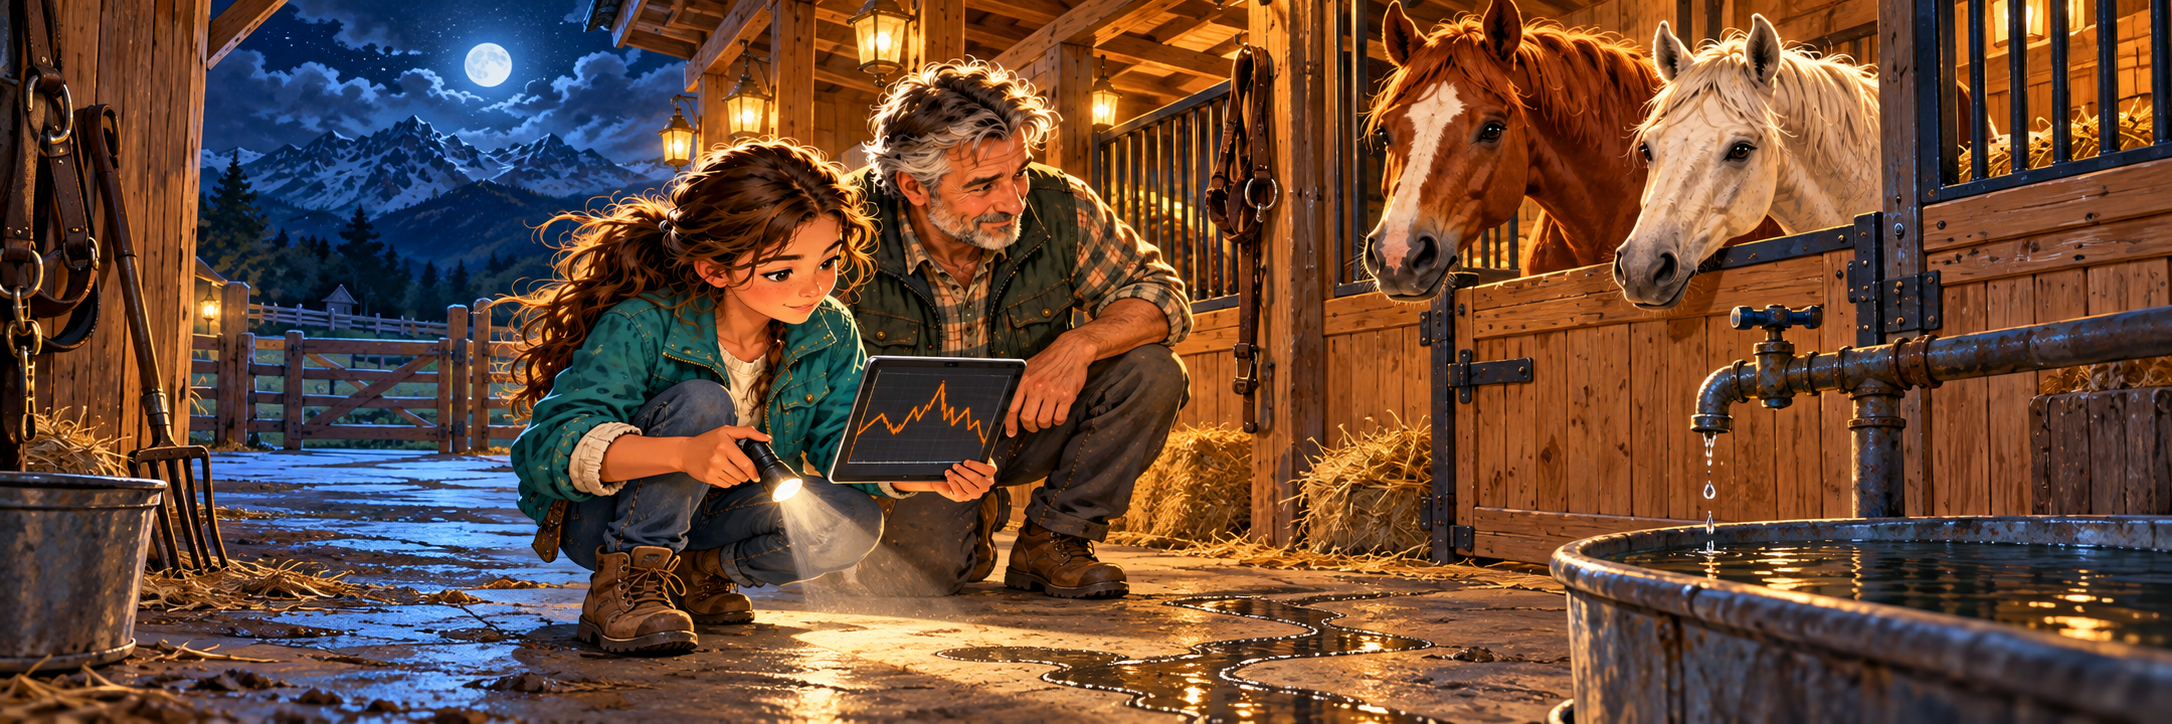
Blitz and Luna are dry, the drain passes inspection, and €3,321 remains in the budget. At midnight, however, the trough monitor sends Mia a jagged set of readings. A working pump should change the water at a constant rate. If the graph bends or its interval rates disagree, something in the system may be leaking or blocked.
Tonight, a straight line means “behaving as expected.” A changing rate means “investigate before another horse moves in.”
A constant rate has a visible shape: equal horizontal steps produce equal vertical steps, so the points sit on one straight line. Mia will use that fact as a diagnostic tool, not merely as a graph rule.
See the rate
The horizontal $x$-axis measures hours ridden. The vertical $y$-axis measures kilometres travelled.
The orange triangle shows $\Delta x=2$ hours and $\Delta y=6$ km. The rate is $m=6\div2=3$ km/hour. The units tell the story: kilometres per hour, not a percentage.
Worked example · A filling trough
A trough contains $18$ L at minute $2$ and $42$ L at minute $8$.
Name the axes. $x=$ time in minutes; $y=$ water in litres.
Calculate signed changes. $\Delta y=42-18=24$ L and $\Delta x=8-2=6$ min.
Calculate and interpret. $m=\frac{24}{6}=4$ L/min. The amount increases by $4$ litres each minute.
Predict the shape. If that rate stays constant, every point lies on one straight rising line.
Practice · Read the story in the graph
Build the complete test
1 · Stable hay delivery. A graph contains the points $(0,5)$, $(2,11)$, $(4,17)$, and $(6,23)$, where $x$ is days and $y$ is hay delivered in bales. (a) Name what each axis measures, including units. (b) Calculate $\Delta x$ from the first point to the last. (c) Calculate $\Delta y$ from the first point to the last. (d) Calculate the rate in bales/day. (e) Decide whether the rate is constant and explain using the points.
2 · Phone battery. The plotted points are $(0,100)$, $(1,88)$, $(2,76)$, and $(3,64)$, where $x$ is hours and $y$ is battery level in percent. (a) Choose INCREASES or DECREASES. (b) Calculate the signed rate in percentage points/hour. (c) Explain using the frame: “Battery level ___ by ___ percentage points each hour.”
direction first → keep the negative sign → percentage points/hour → sentence
Confront the boundary
3 · Test the suspicious trough sensor. The monitor records $(0,2)$, $(1,5)$, $(2,9)$, and $(3,12)$, where $x$ is minutes after the pump starts and $y$ is litres added. (a) Calculate the three interval rates in litres/minute. (b) Decide CONSTANT or NOT CONSTANT and explain whether Mia should mark the system NORMAL or INSPECT.
Consequence: one inconsistent interval is enough to stop Mia from trusting a single prediction for the filling time.
do not trust the joined dots → test every interval → find the mismatch → act
Connect representations
4 · Call the emergency water service. A delivery cart charges $y=4x+2$, where $x$ is water containers delivered and $y$ is cost in euros. (a) Calculate the coordinate when $x=0$. (b) Calculate the coordinate when $x=2$. (c) Calculate the coordinate when $x=5$. (d) State the constant rate with units. (e) Explain what the point $(0,2)$ means.
equation → points → rate beside x → starting call-out fee at x = 0
From here, choose the changes and equations yourself.
5 · Compare two inspection plans. Plan A follows $y=2x+6$ and Plan B follows $y=3x+1$, where $x$ is weeks and $y$ is completed safety checks. (a) State Plan A's rate. (b) State Plan B's rate. (c) Calculate Plan A's value at week $5$. (d) Calculate Plan B's value at week $5$. (e) Choose which plan grows faster and explain why—even though both have completed the same total by week $5$.
separate starting value from rate → notice equal outputs can hide unequal growth
6 · Build the grant evidence album. Mia has already finished $7$ pages documenting the stable and completes $5$ more pages each day. (a) Write an equation using $x=$ days and $y=$ total pages. (b) Calculate the point for $x=0$. (c) Calculate the point for $x=2$. (d) Calculate the point for $x=4$. (e) Explain why the graph must be a straight line.
story → start and rate → equation → points → justify the straight line
Spaced review
7 · Trail checkpoint. A rider is at $(2,14)$ and later at $(7,34)$, where $x$ is hours and $y$ is kilometres. (a) Calculate $\Delta y$. (b) Calculate $\Delta x$. (c) Calculate and interpret the rate.
signed changes → divide in one order → attach km/hour
8 · Units check. A graph's axes are kilometres and hours, and its slope is $12$. Decide whether “$12\%$” is a valid interpretation, and state the correct interpretation.
read both axis units → ask whether they match → choose rate or gradient
9 · Cooling feed room. Temperature is modelled by $42-6h$. (a) Write an inequality for when the temperature is below $12^\circ$C. (b) Solve it and interpret $h$ in hours.
Battery level decreases by $12$ percentage points each hour.
Problem 3a · interval 1
$3$ L/min.
Problem 3a · interval 2
$4$ L/min.
Problem 3a · interval 3
$3$ L/min.
Problem 3b
NOT CONSTANT, so mark the system INSPECT. Equal one-minute steps produce different changes in water.
Problem 4a
$(0,2)$.
Problem 4b
$(2,10)$.
Problem 4c
$(5,22)$.
Problem 4d
€4 per water container.
Problem 4e
Before delivering any containers, the service charges a €2 call-out fee.
Problem 5a
Plan A: $2$ safety checks/week.
Problem 5b
Plan B: $3$ safety checks/week.
Problem 5c
Plan A: $y=2(5)+6=16$.
Problem 5d
Plan B: $y=3(5)+1=16$.
Problem 5e
Plan B grows faster because its rate $3$ is greater than $2$.
Problem 6a
$y=5x+7$.
Problem 6b
$(0,7)$.
Problem 6c
$(2,17)$.
Problem 6d
$(4,27)$.
Problem 6e
Each one-day step adds exactly $5$ pages, so the rate is constant and the points lie on one straight line.
Problem 7a
$\Delta y=34-14=20$ km.
Problem 7b
$\Delta x=7-2=5$ hours.
Problem 7c
$m=\frac{20}{5}=4$ km/hour; distance increases by $4$ km each hour.
Problem 8
No. The axes use different units. The correct interpretation is $12$ kilometres/hour.
Problem 9a
$42-6h<12$.
Problem 9b
$$42-6h<12\quad\mid-42$$$$-6h<-30\quad\mid\div(-6)$$$$h>5$$The room is below $12^\circ$C after more than $5$ hours.
Chapter 4 → Lesson 29: Make the caseThe changing trough rate gives Mia evidence that the water system needs inspection. Repairs will cost more than the €3,321 left in the build budget, so she applies for a community grant. The committee wants the same evidence shown as a table, a graph, and an equation—and each view must tell one consistent story.